Wednesday, August 5, 2015

Race Condition & Life Updates/Status

It's been a while since I've posted anything to this blog.  I thought I would take the time to post an update to what's been going on in my life.  I also wouldn't miss this opportunity to discuss an interesting problem that has come up recently: the race condition, or mutual exclusion.

Career

I've been working for a small startup high-tech company in Reno, NV, called LoadIQ.  Although their domain in working with energy and electrical power consumption analysis is not a field I can say I had any experience with, my expertise with software engineering and abilities to spearhead projects were desired and a perfect fit.

LoadIQ works towards building a product which can be sold to clients who are interested in potential cost-savings of energy utility bills.  Although there are many sub-metering technologies out there provided by dozens of businesses, LoadIQ aims to be unique by offering "more".  While the standard is to provide a description of total energy usage in either household or business/industrial settings, the "more" is to decompose (disaggregate) that total energy usage into individual component "loads", where each load represents a single electrical appliance.  This means that it is possible to describe to clients exactly which appliances they are spending towards their utility bill.

My work with LoadIQ has strictly been with developing the technology that provides this level of "more" to the business.  Although my responsibilities and duties have carried across many other tasks as well, this primary focus has received most of my attention.  Much of this work has involved pedantic implementation tasks.  Of recent, there has been more and more research involved to come up with ideas for the improvement of the disaggregation system.  The potential for papers to write, either journal or technical white papers, is exciting.

From October to April I had been a "Postdoctoral Fellow" under a grant from the NSF.  After that position had ended, LoadIQ kept me on the team as a "Chief Data Scientist".  This position is a prestigious one, even if the company is a small one at the present.   

Publications

On the front of papers and journals however, my list of publications have increased in the past several months.  From my work with NASA, which had already produced one paper in the AAAI conference in March 2014, our journal version of the paper had also been accepted to IEEE Transactions of Human Machine Systems [1].  Beyond that, one of the papers I had been working on that was to be the base paper which introduced the core topic of my entire Ph.D, had also been accepted to IEEE Transactions of Software Engineering [2].  This paper was also announced as a "journal-first" paper for the ESEC/FSE 2015 conference in Bergamo, Italy.  The concept of "journal-first" implies an honor that the paper was one of their best and had received the nod to also appear within a related conference.

[1] J. Krall, T. Menzies, M. Davies, “Better Model-Based Analysis of Human Factors for Safe Aircraft Approach”, conditionally accepted (Nov. 2014), IEEE Transactions on Human Machine Systems

[2] J. Krall, T. Menzies, M. Davies, Geometric Active Learning for Software Engineering, Software Engineering, IEEE Transactions on (May 2015), doi: 10.1109/TSE.2015.2432024


The Race Condition

An interesting problem that came up recently is the race condition.  This concerns the topic of mutual exclusion and producer/consumer topic, where there are N producers and M consumers which know only how to produce or consume a shared resource.  While a producer may generate units for any consumer to use, it is possible, that two different consumers both grab the last remaining unit and consume it simultaneously.  To solve the problem, in which two consumers are "racing" for available units, one must implement a mutual exclusion feature to make sure that resource units are excluded from those in the race that do not "come in first place".
My specific problem is slightly different, but related.  We have data wherein each data point is a period of energy usage of variable time length.  This data is clustered into groups of similar energy usage (kilowatts of power).  Reclustering the data can affect other processes, such as the process which groups the data into periods of fixed time lengths (such as five minute groupings).

The process that performs these groupings is incremental, because new data is constantly arriving, and it is more efficient to group the new data as they come, instead of grouping the entire dataset each time.  This means for example, that on run #1, the first 500 periods of data are grouped.  A day later when there are 100 new periods of data, run #2 will group only those periods from 500 to 600.

Meanwhile, if the data is reclustered, this affects the groupings, and they must be wiped and then started from scratch.   So that after a recluster, run #3 of the grouping process will group the entire dataset from period 0 to 600.

However, there is a race condition that can occur.  Suppose for example, that the grouping process begins, and it sees that it has to now group only from period 600 to 700.  While that grouping process is working on that, a recluster occurs, and wipes out periods 0-600.   The grouping process will finish, and we will have periods 600-700, but periods 0-600 will be wiped and gone.   The next time the grouping process begins, it will see that the most recent period is 700, and it will continue to increment from 700.  Meanwhile, periods 0-600 are permanently gone until the inconsistency is reset and fixed.

The solution here is to provide a mutual exclusion implementation of sorts.  Whenever the recluster occurs, it must write a "wipe" flag somewhere for the grouping process to read before it ever writes any new grouping data.  If the grouping process sees this "wipe" flag, it must make sure that it is processing from scratch, from period 0 and onward.  However, whenever it obtains the wipe flag, it must lock other processes from affecting the flag or the period data, lest another reclustering occur before the grouping process finishes its job and groups all period data.
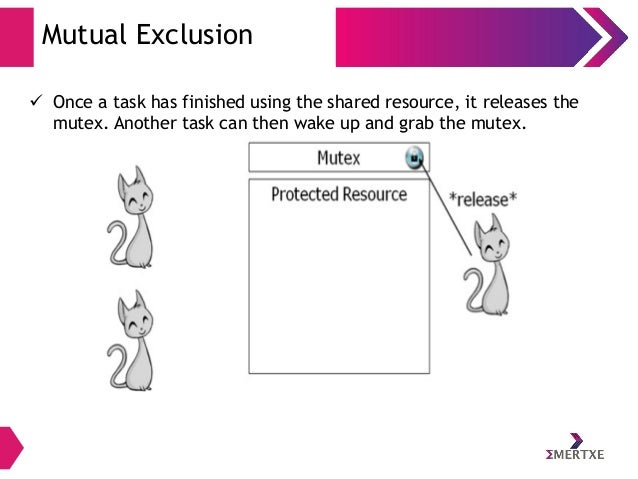


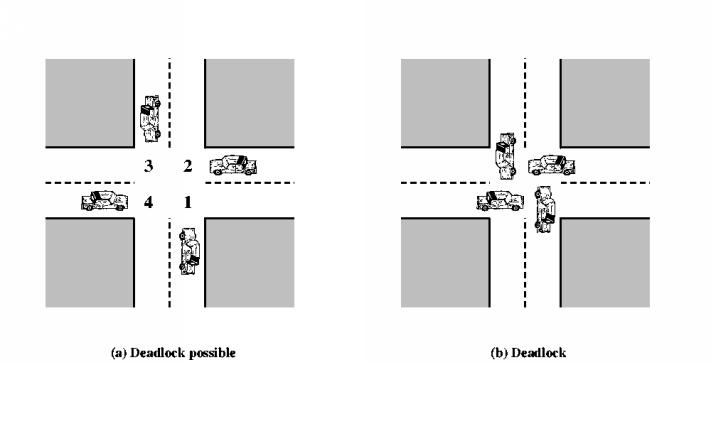
This 'two stage' lock is the typical solution for mutual exclusion, often known instead as a "mutex".  In real life, we can think of this as physically participating in a race.  Even if two people tie, they must break the tie to decide a true winner.  When breaking the tie, the two people are in a state of deadlock until it is resolved, and a winner is declared who obtains the resource/prize.  When waiting at a four-way stop intersection, it may be difficult to obtain the 'mutex', when everyone is waiting on everyone else to make the first move and cross the intersection.


Wednesday, April 22, 2015

Life is a Race

Life has always been a struggle of sorts to win a race in sufficient expansion before imminent disaster resets the race.  Although life will always persevere and remain eternal, the race to reach the ultimate goal is an ever-lasting one.

Just as our ancestors have struggled before great ice-ages, we too have our future struggles to race against.  To expand our horizons before a great disaster arrives and escape its clutching grasps that wishes to beset our earnings in vain; to escape the possible impending doom of an oncoming asteroid, or move to a distant inhabitable planet before our sun supernovas; or to avoid the disaster that could be a gamma ray burst too close to our survival.

And only time will tell, but one day we will either perish and our position in the race reset to zero as the next generation of life has to restart its expansion of knowledge of the sciences and arts from scratch.  Or, we will have rapidly expanded fast enough to overcome such hurdles and prevent such a disaster, by preventing them from ever occurring or simply moving far enough away from such doom.

While the disasters are many, the clear goal is only singular:  to learn, acquire much knowledge, to better ourselves and to reach the end of the race.   A race which will carry us through difficult-to-perceive futures and expands our position in the universe.   A race which feats us against not only our civil-warring selves, but against possible predators that might exist within the universe.   A race which challenges the natural evolution of the universe which should likely refresh itself in massive explosions of renewing energy sources.

And one day, maybe we'll reach that final end-point.   The point where all things in the universe are man-controlled and there is nothing new to discover.  At that point, maybe we will realize the only next step to take is ascension: to rise out of this box we call our home, the universe, and to join our creators or gods in an entirely different dimension, leaving behind the ever-eternal force that is life in a box.  And at that point, we can watch in on what we might one day call our own creation, and observe quietly as new life struggles to win the race we one day may have finished ourselves.

Indeed, maybe they will have completed the race faster than ourselves.  Perhaps we are not the first to have completed that race.  Perhaps, the race was always merely just a simulation -- to challenge the limits of mankind in life to see who can finish fastest.  Maybe there is a greater prize awaiting us all who finish the race.  Life outside the box, outside that greater box?  And simulations within simulations?  And still yet, maybe the race was never meant to be completed, for it is simply too difficult, too impossible with odds too staggeringly low.  All we know, is that the race must go on, even in the face of zero chance of success, one step at a time as rapidly as we can sanely pace them.

Wednesday, February 19, 2014

Short Term vs Long Term Memory

Every semester there are thousands of students preparing for their final exams shortly before escaping for a long-awaited break.  Although they had seen the material being presented in class throughout the semester, when it comes time to be tested on that material, giving the correct answers can be a challenge.

From a cognitive viewpoint, the students had all interred the material into their long term memory when it had been first presented.  But to be able to test well on the material, it has to be moved into short term memory for immediate access.  Without an intuitive understanding of that material however, that move from long to short is difficult.  The more a student truly understand their course material, the easier it is for it to move into short term memory.

Figure 1: Short Term Memory at a certain time, (t).


After the exam, all of that material is generally leaked slowly out of short term memory unless it is periodically used to keep it immediate.  However, once in short term memory implies that it is possible to reinter the material back into short term even if it had been leaked out.  Hence, it is fine for students to 'forget' their material after an exam.  Since now, it will be possible if necessary, for a student to recall that material with ease.

One reference appoints the above notions as Long Term Memory (LTM) and Working Memory (WM) instead of Short-Term Memory.  In that study, their results indicate that LTM and WM are indeed distinct but related constructs [1].

References:
[1] Nash Unsworth.   On the division of working memory and long-term memory and their relation to intelligence: A latent variable approach.  Acta Psychologica, 2010.   Available at http://maidlab.uoregon.edu/PDFs/Unsworth(2010)Acta.pdf.


Friday, January 10, 2014

Containers and Creators

Deep Thought took 7.5 million years to find out the answer to life's ultimate question.  I'll solve it in fewer than 30 minutes.  Attempt to.  Key words appended to this paragraph after 30 minutes had passed.

If we think about life and its origins, it becomes invariably evident that life had to begin at the hands of another.  But this statement as an answer leaves only more questions.  What of the hands of the other?  To date, all religion and faith yields the same unclosed box surrounding the circumstances of life.

Even the Simulation Theory, which states that we are merely a computer program built by the hands of geniuses outside of our box - does not completely close our box of questions.  We then need to ask the question of closing their box instead.  After all, if God created us, then where did God come from?

The closing of the box inevitably begs the curious circumstance of total emptiness at some point in history.  At some point, something existed out of the nothingness.  At that point, two key elements came into question: the creator element and the container element.

In general, our faith has us believe in some super-creator.  Whether this is Simulation Theory or Catholicism, we all invariably place our faith in some super-creator: God, or a genius programmer of sorts.  Thus, the creator is God, and the container is our universe.  As a sizeable creation, our universe has come far in its relative youth, and yet still we have barely even managed to scrape close-encounters to mere fractions of maximum capacities.  Our container is without a doubt, super-huge, and for good reason too.  If our container were ever to be maxed-out, the creator would have a real problem on hand.

But despite such a clear understanding of our box - our container, we have yet to grasp the nature of the container for which the creator lives in.  After all, there are notions of ascension - or descending.  In the Bible, for instance, God supposedly had descended into the body of man - Jesus.  And every one of us are judged at death - and some of us are ascended into heaven.  Ascension is merely the transition from one container to another.  And there may be many containers.  Each of them leave a question to be answered on closure.  For every container had to be created by something outside of it - right?

This description makes it possible that each container is an element of an array.  For instance, the Universe is perhaps, element #43 in the array.  And our creator - God or some genius programmer - is the creator of this container, and who lives in element #42.  Eventually, we harken back to element #0, and wonder who created it.

[Origins, Super-Heaven, Heaven, Universe, Games] is an example of what the array could look like.  We live in the Universe, and we create often, simulations of our own, or play in games online in which you descend into characters stored in servers across the globe.  After you log out, you ascend back into the Universe - back into your real world.  And when you die, perhaps you will ascend back into Heaven, from which you awaken only to have experienced one of the most surreal adventures ever - a game world in which you were tapped into a game-sim of most exquisite nature.  And when you die from the REAL world in Heaven, you ascend into Super-Heaven only to have discovered you have been living your entire life descended into Heaven in yet another game-sim of sorts.  And so on, but eventually, life has to end when you die from the truest of real worlds - the first container element from the array.  Right?

But even still.  Who created the first container element of the array?  Who created the array?  Perhaps the best answer is that none of it truly exists.  But this feels too real, right?  Perhaps, the array is cyclic.  The creator of the Origins container - the first element of the array - is actually the container from the last element in the array - Games.  Is it possible that we, life as we know it, is nothing merely than the result of our descending into and out of worlds?  But still.  Who created the array itself?  What started this vicious cycle in the beginning?

In the end, I believe that our notion on containers and creators is far too specific or far too vague to truly understand the circumstance of life.  The simple truth is that we may never know from being physically coded and instructed not to ever know.  A simple barrier that prevents us from ever understanding and rebelling against the creator.  An elaborate ruse meant to keep us in our place.  After all, what purpose in life would we have if we ever discovered the truth?  Our entire lives have been founded on purpose - if not individually, then surely on the macro level.

Monday, December 9, 2013

On FastMAP: Technique for Dimensionality Reduction

FastMap is a technique for dimensionality reduction.  Consider a dataset consisting of n rows, where each row is a vector of p attributes.  That is, the dimensionality of that dataset is p.  The motivations behind dimensionality reduction are many.  For instance, consider the visualization of such a dataset.  Each row in the dataset can be viewed as a point in p-dimensional space.  But if p is larger than 3, it becomes unworldly to visualize.  Even still, visualization may not explain anything.   Reduction of dimensionality sees more practicality from a computational standpoint for some analysis of the dataset.

FastMap selects a sequence of k of the p dimensions (k <= p), and projects the points from the underlying true-space (p-dimensional space) onto the axes of k-dimensional space.  It was first introduced by [1] in 1995, and identified as an alternative to Multi-dimensional scaling in [4].  FastMap is a generalization of Principal Components Analysis (PCA) [2].

PCA was introduced in 1901 by Pearson [3] as an analog to the principal axes theorem, and later formalized by Hotelling in [2].  PCA can be done by either an eigenvalue decomposition of a covariance matrix from the data, or by a singular value decomposition method of the dataset itself.  The result of PCA is essentially a list of the p-dimensional axes, such that the first principal component (the first axis in the list) has the largest variance along it (accounts for most of the variance in the dataset, and each subsequent component is an orthogonal component with the most accounted variance below the previous.

FastMap employs a procedure similar to PCA.  The theoretical perspective is that each component consists of "pivots" which are the two most extreme points along that axis (remember components are axes).  Given the p-many components, each orthogonal to the previous, it becomes clear that these pivots are the vertices of a convex hull surrounding the dataset.

The FastMap procedure is as follows.  Given a dataset S, and the Euclidean distances between each member in S, we first pick any arbitrary member in S and then look for the member which is furthest away from it.  This is the first of two pivots, call it East.  The second pivot, called West, is the member furthest away from the first pivot.  With these two pivots selected, the projected coordinate (onto the 1-dimensional line) of each member in the dataset is as follows.

x = the member being projected
c = distance from East to West
a = distance from East to x
b = distance from x to West

projection(x) = (a^2 + c^2  - b^2) / (2c).

This projection is based on the law of cosines.  This process can be repeated k times to obtain k dimensions, as each repeat adds elements to the projections.  Each subsequent repeat works implicitly on the projected space as it grows, in which each pair of pivots adds vertices to the shape that surrounds the dataset in its true-space.  In this manner, FastMap is very similar to the vertex growing method of the Simplex Search technique, in which vertices are grown with the intent of converging the convex hull of the Simplex around solutions to the search space.

The connection here for FastMap and Multi-Objective Optimization is as follows.  Note that in the Simplex Search Technique, a simplex is used and the key technique is that only exterior vertices of the simplex are evaluated.  For FastMap to be used within a search technique, only those pivots of the convex hull surrounding the dataset need to be evaluated.

The theory is that if only the convex hull pivots are evaluated, good search results can be attained, but in very few evaluations.  This is the basis of the GALE algorithm for Multi-Objective Optimization.  The validation and evidence to this theory is given in results that say GALE can achieve comparable results to state-of-the-art algorithms such as NSGA-II and SPEA2.

For the reader unfamiliar with GALE: it stands for Geometric Active Learning Evolution.  Whereas standard search tools such as NSGA-II and SPEA2 are well known and extensively referenced in literature, they are "blind" in the sense that their approaches to search involve random perturbations of individuals in the dataset.  The hope and theory for those search tools is that eventually, these random perturbations will lead to better and better solutions, but only after many evaluations.  When the method of evaluation of an individual is complex and untimely, this can become a huge problem.  The advantage of GALE is that it can achieve comparable performance while greatly reducing the number of model evaluations.  In results for standard modeling problems, this speedup factor was between 20 and 89.  (Which means 20-80 evaluations versus 1600-4000 evaluations, for population sizes of MU=100.)  In terms of MU=population size, the expected number of evaluations for NSGA-II and SPEA2 is exactly MU*GENS*2, where GENS = the number of generational iterations of the search tool.  For GALE, this expected value is no greater than GENS*2*log(base2 of MU).


[1] C. Faloutsos and K. Lin, Fastmap: A fast algorithm for indexing, data- mining and visualization of traditional and multimedia datasets, ACM SIGMOD Conference (San Jose, CA), May 1995, pp. 163–174.

[2] Harlod Hotelling, Analysis of a complex of statistical variables into principal components, J. Educ. Psych. 24 (1933), 417–441, 498–520.

[3] Pearson, K. (1901). "On Lines and Planes of Closest Fit to Systems of Points in Space" (PDF). Philosophical Magazine 2 (11): 559–572.

[4] W. S. Torgerson, Multidimensional scaling i: Theory and method,
Psychometrika 17 (1952), 401–419.

[5] George Ostrouchov and Nagiza F. Samatova. 2005. On FastMap and the Convex Hull of Multivariate Data: Toward Fast and Robust Dimension Reduction. IEEE Trans. Pattern Anal. Mach. Intell. 27, 8 (August 2005), 1340-1343. DOI=10.1109/TPAMI.2005.164 http://dx.doi.org/10.1109/TPAMI.2005.164

Monday, September 9, 2013

#27 - Towards a Ph.D. Thesis Proposal: NextGen Project and Optimization Strategy

With about 7 months remaining until a target graduation date, the first month has to entail projection and proposal.  The next three months from here til the end of year entail the core work and research on that proposal.  The final four months focus on developing the dissertation culminating that core work as well as attributing work done previously.  When I'm at a loss of ideas, I find that writing them out sometimes help them come forward.  It's like that in creative writing: don't think about what to write, just let the words come out.  Creativity and ideology live in the brain; writing can be an effective way for them to channel outward.

"What are my birds?" is asked by my advisor.  I have an algorithm called GALE, which can perform multi-objective optimization in very few evaluations.  This sounds really cool, but this is purely at this point, an algorithmic state of affairs.  Who cares?  What about the application of such an algorithm and its attributes to bettering the world?  This is the algorithms vs applications conflict.  Many theses and topics of research live purely in the world of algorithms, but lately a push for application-world research is called for.

GALE can optimize stuff, and learn stuff in few evaluations of the model.  If I want a thesis out of this, I need to find a way to tie the importance of this into the applications world.  Why would doing things faster be a good thing?  The only thing I can think of is for the affairs of safety-critical devices where speed is a requirement.  Secondly, what does it mean to learn stuff in few evaluations, blah, blah, really need to jump away from algorithmic-speak.

What The Birds Are


Overall, I have about four things in general that can be called my birds here.  First and foremost I have an algorithm called GALE.  This algorithm is a tool for software engineering researchers and intelligent systems design.  They key here, is that GALE can be used to aid in the development of systems that can analyze its environment and make expert decisions very quickly.  The obvious bit here is that it might be highly critical of the system to make those decisions quickly, e.g. consider systems where decisions affect the safety of human lives.  Furthermore, if the system cannot make those decisions quick enough, say, to react to very unexpected and sudden environment changes, then the safety of lives might also be endangered.

The the algorithmic world which GALE lives in, it needs a simulation to study as its environment.  In the application world, this simulation becomes the environment through machine learning.  This transition is a long way off, but the connection between optimization studies (like with GALE) and machine learning (using optimization to learn) is slowly becoming stronger every day.  It might be sensible to believe that one day in the future these two fields would merge and become one.

For now, we use GALE with a simulation in the algorithm world.  The first study on GALE was performed on a simulation called POM3, in which the process of completing a software project is modeled through requirements engineering (i.e. how best to plan a strategy of completing tasks to the project).  POM3 as a simulation has a handful of decisions that can be made, as well as a set of objectives to optimize in decision making.  Remember that anytime a decision is made, the critical-thinking process here is an aim to optimize some goal - e.g. what type of car should I buy?  We have goals of minimizing cost, maximizing MPG, maximizing aesthetic appeal, etc.)  For POM3, these goals were Completion (percentage of tasks that were completed, because a lot of projects only get so far before termination), Cost (total money spent), and Idle Rate (how often developers were waiting around on other teams).  The decisions were things like team size, size of the project, and other more domain-specific decisions to software engineering.

Going back to developing a thesis proposal; POM3 doesn't really fit our needs.  We'd like a simulation that can be optimized with GALE but has some application-world use where the power of making decisions quickly is very important.  POM3 isn't really safety-critical at all.  While it was a good and meaty simulation with many decisions and objectives, it just won't cut it for proposal in a thesis that wants to live in the application world.

The NASA Birds


My last two birds are two projects from my work out in California with NASA Ames Research Center.  These two projects involve aerospace research, and while one is a simulation, the other is a tool for ensuring safety of flight.  So it sounds like right away, we might have tools on hand for a thesis if we can combine the two projects.  WMC (Work models that compute) is the simulation, while TTSAFE (Terminal Tactical Safety Assurance Flight Evaluation) is the tool for conflict detection of aircraft - to make sure they don't collide in airspace.  Sounds trivial, but there's problems that need to be kept contained.

TTSAFE merely examines an input file containing codes that deal with aircraft locations, flight plans, tracking data, velocities, altitudes, and more.  This input file feeds into TTSAFE and a conflict detection algorithm determines if there are multiple aircraft heading towards each other on a collision course.  There are three main parameters here for such an algorithm.  The first is how often TTSAFE checks airspace for conflicts (granularity).  Secondly, to identify conflicts, a line can basically be drawn starting from every aircraft in airspace, and extending along the path of its velocity and direction.  If there are any two lines that intersect, then there is a conflict between the two aircraft of those two lines.  The second parameter here is how long to drawn the lines, e.g. 3 nautical miles, 10 nautical miles (or perhaps measured in time).  Thirdly, lines may not need to intersect to conflict, but instead merely come close to each other.  So the third parameter is the safe radius around the aircraft.

Once TTSAFE identifies conflicts, it proposes resolutions to those conflicts, and flight plans are adjusted based on rules of right-of-way in airspace.  There are problems with such a conflict detection algorithm because not all identified conflicts are truly a real conflict.  For instance, some aircraft may be on their way in making a turn, so while the velocity and current directions extend a line that intersect that of another aircraft, there would never have been a conflict because the aircraft was in the process of making a turn that "tricked" TTSAFE into believing there'd be a conflict.  Nevertheless, such a False Alarm is taken seriously and the aircraft is signaled to adjust flight plan - lengthening its miles traveled; costs more; takes longer to fly.  Overall, these are things we want to optimize, but false alarm rate is a major conflicting objective.

WMC is a project out of Georgia Tech which deals with computing trajectories for aircraft on approach to runways to land.  The computations rely on physics, aircraft type, and introduces cognitive measures that model the manner in which pilots take action in approaching the runway.  WMC is a simulation.  Taking only one aircraft at a time along with its flight plan and a starting point, starting velocity and starting altitude, it simulates the landing of that aircraft, yielding tracking data throughout to its completion.

After WMC simulates the landing of an aircraft, it can add its tracking data into TTSAFE along with the rest of airspace.  TTSAFE then determines if such a landing approach is safe, and if not, then resolutions are given and WMC re-computes the landing approach, and so on.  Since WMC only deals with landing, we need to realize that our "birds" here only deal with local airspace surrounding, say, 50 miles around an airport.  So there is no need to consider cross-country flights from takeoff to landing; but instead we would be in a sense, "spawning" aircraft randomly inside the 50 mile radius around an airport.  To further stress-test the system and emphasize the power of GALE, such extreme circumstances can be invented in airspace that otherwise might not naturally occur.  For example; what if an aircraft is hijacked and begins ignoring commands from ground control?  Or more calmly, what happens if some aircraft in general ignores a command and doesn't adjust flight plan?

How to Fly The Birds


TTSAFE and WMC on their own are fully developed.  The interaction between the two is not.  I'm wondering if it such a task could be completed timely in few short months.  TTSAFE is coded in Java, and WMC is coded in c++0x.  I can run them each on their own.  Furthermore, GALE is coded in Python.  Unless a clever bash script can tie everything together, I could be stuck figuring out how to fly the birds.  The main problem is figuring how to pass data between all three.  File I/O might be a bad idea, but the only probable one.  Going forward, I suppose the best thing is to take it one step at a time.  After all, four years ago I never thought I'd be able to be here because I looked at it as one giant step.  Instead, the many small steps are what got me here - and they are also the way forward.

Step 1) WMC has a problem with simulating only an aircraft of a predefined type.  It needs to be adjusted so that it simulates for an aircraft of an input type.  Thus, it should be able to read its parameter information from the BADA database for that aircraft type.

Step 2) Develop a script which can run WMC a bunch of times for random aircraft types, along with randomized parameters of decision nature (such as those for the cognitive models).

Step 3) Try to tie GALE with this WMC script from step 2.  If we can do this, then any roadblock with further connecting TTSAFE with everything should be understood and made simpler.  Then, although the practicality of optimizing WMC may not be understood, at the very least we can see how GALE runs with WMC (and how it runs using similar algorithms like GALE, i.e. NSGAII or SPEA2).    Note that I'm most worried about the "if we can do this" part.

Step 4) Make a script which generates an airspace of aircraft with variety of flight plans around a small radius about an airport.  This will be an input to the overall system that we ultimate aim to have.

Step 5) Feed the airspace of step 4 into WMC to generate accurate trajectory data for all aircraft.  This means we adjust the script of step 2, so that it instead doesn't generate random aircraft, but instead takes input from the airspace of step 4.  As for cognitive decision parameters, we use what we learned from step 3.

Step 6) We need a script now that feeds data from WMC back into TTSAFE.  Basically, we just need a way to adjust the tracking data in the airspace input file (made initially in step 4).

Step 7) Lastly, a script that combines all of these into a loop that runs until all aircraft land.  Then we compute statistics and metrics for the process - stuff we want to optimize.

Step 8) Step 4-7 become our ultimate model.  Whatever we call this, we then feed it through GALE vs NSGAII vs SPEA2 to optimize things and learn things, blah, blah.

Step 9) Adjustments, twitches, fixes.  Looking for and getting sane data from step 8.

Step 10) If we have sane data, then can we publish it?  i.e. can we go forward and put it all into a thesis proposal?

Tuesday, July 9, 2013

Krall Numbers

I'd always been interested in this kind of number I had discovered.  What you do is take any ordinary positive integer, most typical here is 7, and you look at all of its fractions under 1.  That is, look at the fractions 1/7, 2/7, ... all the way up to 6/7.  Expand those fractions, and then check out their decimal expansions.

Here, we see each respective decimal expansion in sequence.  The most interesting thing here is that there are patterns to be found in each expansion.  The pattern for the number 7 seems to be "142857".  This pattern cyclically repeats itself all throughout each expansion for the number 7.  The needed shift to match the cyclic pattern is also shown below, and the pattern being matched is indexed at the end of each line.

0.142857142857    , shift=  0,pattern#=  1,*
0.285714285714    , shift= -2,pattern#=  1,*
0.428571428571    , shift= -1,pattern#=  1,*
0.571428571429    , shift=  2,pattern#=  1,*
0.714285714286    , shift=  1,pattern#=  1,*
0.857142857143    , shift=  3,pattern#=  1,*

Some numbers have more than one pattern.  For example, the number 8 has 7 unique patterns.

0.125               , shift=  0,pattern#=  1,*
0.25                , shift=  0,pattern#=  2,**
0.375               , shift=  0,pattern#=  3,***
0.5                 , shift=  0,pattern#=  4,****
0.625               , shift=  0,pattern#=  5,*****
0.75                , shift=  0,pattern#=  6,******
0.875               , shift=  0,pattern#=  7,*******

However some numbers are a little more interesting.  There are identifiable patterns in the pattern index itself!  For example, check out number 11, where the stars at the end form a symmetric mountain of sorts.

0.09090909090909090909    , shift=  0,pattern#=  1,*
0.18181818181818181818    , shift=  0,pattern#=  2,**
0.27272727272727272727    , shift=  0,pattern#=  3,***
0.36363636363636363636    , shift=  0,pattern#=  4,****
0.45454545454545454545    , shift=  0,pattern#=  5,*****
0.54545454545454545455    , shift=  1,pattern#=  5,*****
0.63636363636363636364    , shift=  1,pattern#=  4,****
0.72727272727272727273    , shift=  1,pattern#=  3,***
0.81818181818181818182    , shift=  1,pattern#=  2,**
0.90909090909090909091    , shift=  1,pattern#=  1,*

And for number 13, we see again another symmetric pattern in the stars:

0.076923076923076923076923    , shift=  0,pattern#=  1,*
0.153846153846153846153846    , shift=  0,pattern#=  2,**
0.230769230769230769230769    , shift=  2,pattern#=  1,*
0.307692307692307692307692    , shift=  1,pattern#=  1,*
0.384615384615384615384615    , shift=  4,pattern#=  2,**
0.461538461538461538461538    , shift=  2,pattern#=  2,**
0.538461538461538461538462    , shift=  5,pattern#=  2,**
0.615384615384615384615385    , shift=  1,pattern#=  2,**
0.692307692307692307692308    , shift=  4,pattern#=  1,*
0.769230769230769230769231    , shift=  5,pattern#=  1,*
0.846153846153846153846154    , shift=  3,pattern#=  2,**
0.923076923076923076923077    , shift=  3,pattern#=  1,*

And perhaps, others have no pattern at all, such as for the number 37.  And others, have some truly odd quirks, such as in 26 when you look at the expansions for 22/26 and 23/26.  In fact, you see this a lot.

There's much we can learn and marvel at just by examining expansion sequences in this way.  You can try it yourself with this python script that I developed, located at: http://pastebin.com/a5UY0F0i.  To run the script, use "python krall_numbers.py 7" to run the test on the number 7.  Simply replace the number 7 with any number you want to experiment with.